Customer Journey Stages and How to Measure Them in GA4
Which customer journey stages are there, and which channels really lead to an enquiry? Here is how to measure the journey with GA4, UTM parameters and your CRM.

What customer journey stages are there?
The customer journey is the path a person takes from their first encounter with your business to a purchase or enquiry, and beyond. A widely used model has five customer journey stages: awareness, consideration, decision, retention and advocacy. There is no standard. Some models combine stages or split them more finely. The stages of the customer journey help you sort channels and content, and check whether something measurable happens in every stage.
- Awareness: someone sees your brand for the first time, for example through an ad, a post or a recommendation.
- Consideration: the person compares options, reads guides and looks at prices and references.
- Decision: they make an enquiry, call, book or buy.
- Retention: after the purchase come the invoice, service, newsletter and repeat orders.
- Advocacy: satisfied customers recommend you and so start new journeys.
For customer journey tracking, it is important that every stage has a measurable signal. In the consideration stage, that can be a visit to the pricing page or a download, and in the decision stage the generate_lead or purchase event. Without such events, the analysis stops at page views.
The stages can be roughly linked to channels. Advertising on social networks and display advertising often work early, when nobody is searching for you yet. Guide articles, comparison pages and search ads for general terms reach people who are weighing things up. Searches for your company name, direct visits and newsletter clicks are often shortly before the decision. This assignment is not a fixed rule, but it explains why a channel can look weak in a report and still be important.
What does a customer journey analysis show?
A customer journey analysis shows which channels and touchpoints lead people to your business, and which of them actually lead to enquiries and sales. It combines data from website analytics, from ad accounts and, ideally, from your CRM. The result is not a pretty poster with arrows, but a solid answer to the question of what you should spend money on and what you should not. This article therefore concentrates on measuring: which data you need, how to evaluate it in Google Analytics 4 and where the limits lie.
Hardly anyone buys on first contact. A typical path looks like this: an ad on Instagram, days later a Google search for the company name, a look at the prices, then a newsletter, and finally the enquiry. If you only look at the last click, you see just one step of this and easily draw the wrong conclusions.
→ Cookie banner with Consent Mode v2: compliant, with no monthly licence
Customer journey tracking: the data you need
The foundation is a clean source for every visit. Google Analytics 4 automatically assigns visits to channels based on source and medium, such as organic search, paid search, social networks or email. For this to work, links from newsletters, social media posts and campaigns outside Google need UTM parameters. Google Ads tags clicks automatically if auto-tagging is active and the account is linked to GA4.
The second foundation is events for every important touchpoint on the site: form submitted, phone number clicked, catalogue downloaded, product added to the basket. You mark the most important ones in GA4 as a key event, which is what conversions have been called in GA4 since 2024, so that they appear in reports and in attribution. The third foundation is working consent, because without consent GA4 captures visits only in a limited way, or not at all.
Evaluating paths and attribution in GA4
Google Analytics 4 (GA4) shows the path to conversion in several places. In the Advertising section, under Attribution, you will find a path report, called “Conversion paths” or “Attribution paths” depending on the state of the interface. It shows which sequences of channels came before a key event, for example paid search, then direct, then organic search. There you can also see how many touchpoints and days it typically takes to complete.
Under Explorations, you can create a path exploration that shows sequences of pages and events within the website. A funnel exploration shows at which step visitors drop off. For weighting the channels, GA4 uses data-driven attribution by default, which estimates the contribution of each touchpoint from your data. Alternatively, there is last click across all channels and a variant that favours the last click on a Google ad. Compare both to see which channels tend to appear early on the path and which tend to appear at the end.
The two standard acquisition reports also help for a quick overview. User acquisition shows through which channel new users first arrived. Traffic acquisition shows the channel of each individual session. If the two are far apart, that is a sign that many people enter through one channel and later return through another, typically through a search for the company name or directly.
| Report | Where in GA4 | What it shows |
|---|---|---|
| Conversion paths or attribution paths | Advertising, Attribution | Sequences of channels before a key event, days and touchpoints until completion |
| Path exploration | Explorations | Sequences of pages and events on the website |
| Funnel exploration | Explorations | At which step visitors drop off |
| User acquisition | Reports, Acquisition | Channel through which a user first arrived |
| Traffic acquisition | Reports, Acquisition | Channel of each individual session |
Before you draw conclusions, a short check routine is worthwhile. A very high share of direct visits often points to missing UTM parameters in newsletters or to links from apps. If payment providers such as PayPal appear as a referral source, purchases lose their real channel, because the return from the payment process counts as a new visit. The list of unwanted referrals in the data stream settings fixes this. Events that fire twice inflate individual channels. Such errors distort every customer journey analysis, however good the model is.
→ Setting up Google Consent Mode v2 correctly: no warning in Tag Assistant
Where does measuring the customer journey reach its limits?
Every customer journey analysis has blind spots. If you know them, you interpret the numbers more cautiously and look specifically for additional data.
- Devices: someone who sees the ad on their phone and orders on a laptop usually appears as two different users unless they sign in.
- Consent: visitors who decline are missing from the paths or are only estimated.
- Browsers: Safari limits cookies set by JavaScript to 7 days, so longer paths break off.
- Offline: phone calls, trade fair conversations and recommendations are not seen by any analytics tool on its own.
- Closing the sale: whether an enquiry turns into an order is known only to your CRM.
These limits are no reason to give up on measurement. They are a reason to connect the website data with data from sales. Only then do you see not just which channel brings enquiries, but which channel brings revenue.
Enquiries with their source into the CRM, and sales back
The most important step towards a complete customer journey is to attach the source to every enquiry. To do this, UTM parameters and click IDs such as gclid from Google Ads or fbclid from Meta are stored on the first visit and sent along in hidden fields when the form is submitted, even if the visitor has looked at several pages beforehand. In the CRM, every contact then shows which campaign it came from.
A B2B IT security provider implemented exactly this. Before, GA4 showed about two dozen enquiries a month, spread across Google Ads, LinkedIn and organic search. Which of them became orders was known only to sales. After the change, every enquiry lands in HubSpot with its source, campaign and click ID. When a quote is won, the closing goes back to Google Ads as an offline conversion. That way, Google Ads no longer optimises for enquiries alone, but for enquiries that turn into revenue.
Measuring the customer journey with Trackum
Trackum sets up measurement so that it carries through all stages: Google Analytics 4 with key events and Consent Mode v2 as a setup for €150, plus, as extras at €50 each, campaign data in forms, enquiries into the CRM (for example HubSpot or Pipedrive) and sales back to Google Ads and Meta. With the Trackum dashboard, you see visitors, enquiries, sales, ad spend and ROAS per campaign, updated daily. All prices excl. VAT.
If you first want to see whether the foundation is right, the free check for €0 tests your site in a real browser: it opens it without answering the cookie banner, after rejecting and after accepting, and shows which tags and cookies load each time. For every finding, it names a fixed price, with no sign-up and in about two minutes.
Frequently asked questions
What customer journey stages are there?
A widely used model has five stages: awareness, consideration, decision, retention and advocacy. Some models combine stages or split them more finely, but the basic idea is the same everywhere.
What is meant by customer journey analysis?
You evaluate which channels and touchpoints people go through, from their first encounter with a brand to a purchase or enquiry. The aim is to put budget and content where they actually contribute to the sale.
Can Google Analytics 4 show the complete customer journey?
No. GA4 only sees visits to your website, and only from visitors who have agreed to measurement. Conversations, trade fairs, recommendations and sales closings are missing unless you add them from your CRM.
How do I connect website enquiries with later sales?
Store UTM parameters and click IDs such as gclid in hidden form fields and pass them to the CRM with every enquiry. If an order results, you can report the sale back to Google Ads and Meta as an offline conversion.
Sources
- Google Analytics Help: Get started with attribution support.google.com
- Google Analytics Help: Path exploration in GA4 support.google.com
- Google Analytics Help: Collect campaign data with custom URLs (UTM parameters) support.google.com
- Google Ads Help: Import offline conversions support.google.com
Read more
 Features
Cookie banner with Consent Mode v2: compliant, with no monthly licence
Reject on the first layer, settings per purpose, Consent Mode v2 with every consent type and a record of each choice. No monthly licence.
 Features
Setting up Google Consent Mode v2 correctly: no warning in Tag Assistant
The most common warning in Tag Assistant says a tag read consent before a default was set. How to avoid it, and what else matters.
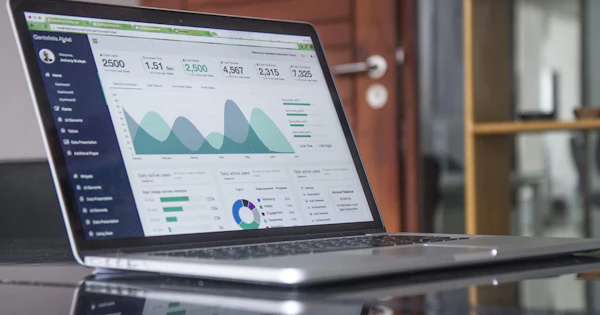 Features
Marketing dashboard with GA4 and Google Ads: every number on one page
Visitors, leads, orders, ad spend and ROAS per campaign on one page, compared with the previous period. One link, nothing to set up.
 Features
Revenue from your CRM, shop and ERP in one dashboard: HubSpot, Shopify, Odoo and more
Google Analytics only sees what happens on the website. Orders by phone or email are missing. With a data connection, the real revenue from your system appears in the dashboard.
 Features
Website leads with their source in your CRM: HubSpot, Pipedrive, Brevo, Salesforce or webhook
Where did the lead come from? The CRM handover writes source, campaign and click ID into the CRM with every enquiry, without a form plugin.
 Features
Offline conversions: report sales from your CRM to Google Ads and Meta
Google Ads and Meta learn from what you report to them. If they only get form fills, they optimise for form fills. With offline conversions, they optimise for sales.