Marketing funnel: stages, metrics and how to measure it
Four funnel stages, the right metric for each stage, the events in GA4 for a funnel exploration and the places where data typically gets lost in the funnel.

A marketing funnel describes, in stages, the path people take from first contact with your offer to purchase. Fewer people arrive from one stage to the next, hence the funnel shape. The funnel shows you at which stage most people drop off. It also makes it measurable whether a change works. This article shows four stages, the right metric for each stage, the events for Google Analytics 4 (GA4) and the places where data typically gets lost.
What is a marketing funnel and what is a sales funnel?
The funnel model shows the buying process as a funnel: at the top many people getting to know you, at the bottom a few who buy. The marketing funnel usually means the upper and middle part, up to the point where someone enquires or puts something in the basket. The sales funnel is the sales team’s view and runs from the lead through quote and negotiation to closing. In practice it is one continuous path. Only when you measure both parts do you see what marketing achieves in the end.
Put the model in perspective: real customers rarely take a straight path. They come back several times, compare providers and switch devices. The funnel is a simplification that makes numbers comparable. It is not a description of every individual customer.
Which stages does the funnel have and which metric goes with each?
| Stage | Question | Metrics | Source of the data |
|---|---|---|---|
| Awareness | Who sees your offer? | Impressions, reach, clicks | Ad accounts, Search Console |
| Interest | Who looks at what you offer? | Sessions, engaged sessions, product or service pages viewed | GA4 |
| Enquiry or intent to buy | Who shows concrete intent? | Form submitted, call, basket, checkout started | GA4, ad accounts |
| Purchase or job | Who becomes a customer? | Purchases, jobs, revenue, cost per customer | Shop, CRM, accounting |
One main metric is usually enough for each stage. The ratio of two stages is the transition rate, for example enquiries divided by sessions or purchases divided by baskets. It shows you where the funnel gets particularly narrow.
→ Cookie banner with Consent Mode v2: compliant, with no monthly licence
How do you make the funnel measurable in GA4?
In GA4 you map the funnel with events. For online shops, Google has defined recommended events that describe the path to purchase, and for enquiries there is generate_lead. Use the names exactly as they are, because reports and advertising platforms know them.
- view_item: product or service page viewed
- add_to_cart: product put in the basket
- begin_checkout: checkout started
- purchase: purchase completed, with transaction ID, value and currency
- generate_lead: enquiry submitted through a form
With these events you build a funnel exploration in the GA4 Explorations. According to Google Help, a funnel can have up to ten steps. Each step is defined by conditions, for example an event. You decide whether it has to directly follow the previous one. In an open funnel, users can enter at any step, in a closed one they have to go through the first step.
Example: the funnel of an online shop
Suppose a shop counts these values in a month: 10,000 sessions, of which 2,500 with a product view (view_item), 400 with a basket (add_to_cart), 150 with a checkout started (begin_checkout) and 90 with a purchase (purchase). The transition rates are 25% (session to product view), 16% (to basket), 37.5% (to checkout) and 60% (to purchase). Overall, 0.9% of sessions end in a purchase. The rate from product view to basket is the lowest. Whether 16% is a problem is only shown by comparison with the previous month and with the time before a change to the shop.
Here is how to approach such an evaluation: first look for the stage with the biggest deviation from the previous month, not the one with the lowest rate. Then check whether the tracking is right there. Only after that do you change something on the page, and always in one place only, so that you can attribute the effect. Depending on the stage, possible starting points are:
- Product view to basket: price, delivery time and images, a clearly visible button on mobile too.
- Basket to checkout: show shipping costs early, allow ordering without a customer account.
- Checkout to purchase: payment methods offered, understandable error messages, load time of the payment page.
Be careful with sudden drops: if a transition rate falls sharply from one day to the next, the tracking is more likely broken than buying behaviour having changed. Check in the Google Tag Manager preview whether the event is still being fired.
→ Setting up Google Consent Mode v2 correctly: no warning in Tag Assistant
Where does data get lost in the funnel?
- Consent: visitors who reject the cookie banner do not appear in GA4 at all or only partly. The upper stages are therefore too small.
- Payment page on another domain: without cross-domain measurement, the session breaks off. The purchase is attributed to the payment provider as a referral.
- Missing or duplicate events: with some themes add_to_cart is not fired, and purchase is sent twice when the thank-you page is reloaded.
- Forms: an enquiry is counted, but the CRM lacks the source.
- Offline steps: calls, appointments, quotes and jobs happen outside the website and are invisible to GA4.
- Ad blockers and browser restrictions: some of the visitors are not measured.
A funnel is only as good as the data beneath it. If the number of purchases in GA4 permanently differs from the orders in the shop, check the tracking first before you change the shop.
How do you close the last gap to the purchase?
For service businesses and in B2B, the last stage, from lead to customer, mostly sits in the CRM. Save the source in every enquiry (UTM parameters and click ID), maintain the status in the CRM and report jobs back to Google Ads and Meta. Then you can evaluate the whole funnel per campaign.
Trackum sets up tracking for the stages: events in GA4 through Google Tag Manager (setup €150), campaign data in forms and sales back to the advertising platforms as extras (€50 each, excl. VAT). The free check at trackum.app/check shows in two minutes which tags and cookies load on your site.
Frequently asked questions
What is the difference between a marketing funnel and a customer journey?
The funnel is a simplified model of stages in which fewer people arrive from one stage to the next. The customer journey describes the real, often winding paths of individual customers across several touchpoints and devices. The funnel suits numbers, the journey suits understanding.
How many stages should a funnel have?
As many as you can sensibly measure. Four to five stages are enough for most websites. The funnel exploration in GA4 allows up to ten steps.
How do I build a funnel in GA4?
In GA4, open Explorations, create a funnel exploration and define the steps through events such as view_item, add_to_cart, begin_checkout and purchase. The prerequisite is that these events reach the property.
What is a good transition rate in a funnel?
There is no universal figure, as it depends on industry, price and traffic source. Compare the rates with your own values from earlier periods, and check sudden drops for tracking errors first.
Sources
- Google Analytics Help: Funnel exploration support.google.com
- Google Analytics Help: Recommended events support.google.com
- Google for Developers: Measure ecommerce in Google Analytics 4 developers.google.com
Read more
 Features
Cookie banner with Consent Mode v2: compliant, with no monthly licence
Reject on the first layer, settings per purpose, Consent Mode v2 with every consent type and a record of each choice. No monthly licence.
 Features
Setting up Google Consent Mode v2 correctly: no warning in Tag Assistant
The most common warning in Tag Assistant says a tag read consent before a default was set. How to avoid it, and what else matters.
 Features
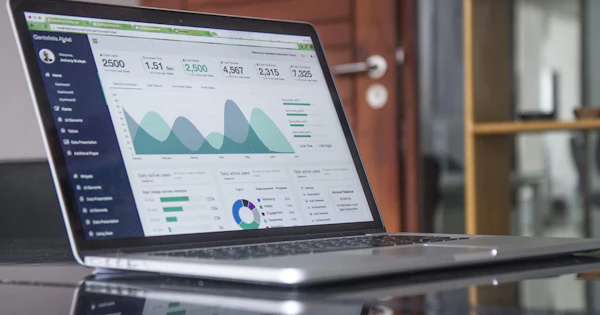
Marketing dashboard with GA4 and Google Ads: every number on one page
Visitors, leads, orders, ad spend and ROAS per campaign on one page, compared with the previous period. One link, nothing to set up.
 Features
Revenue from your CRM, shop and ERP in one dashboard: HubSpot, Shopify, Odoo and more
Google Analytics only sees what happens on the website. Orders by phone or email are missing. With a data connection, the real revenue from your system appears in the dashboard.
 Features
Website leads with their source in your CRM: HubSpot, Pipedrive, Brevo, Salesforce or webhook
Where did the lead come from? The CRM handover writes source, campaign and click ID into the CRM with every enquiry, without a form plugin.
 Features
Offline conversions: report sales from your CRM to Google Ads and Meta
Google Ads and Meta learn from what you report to them. If they only get form fills, they optimise for form fills. With offline conversions, they optimise for sales.